できること
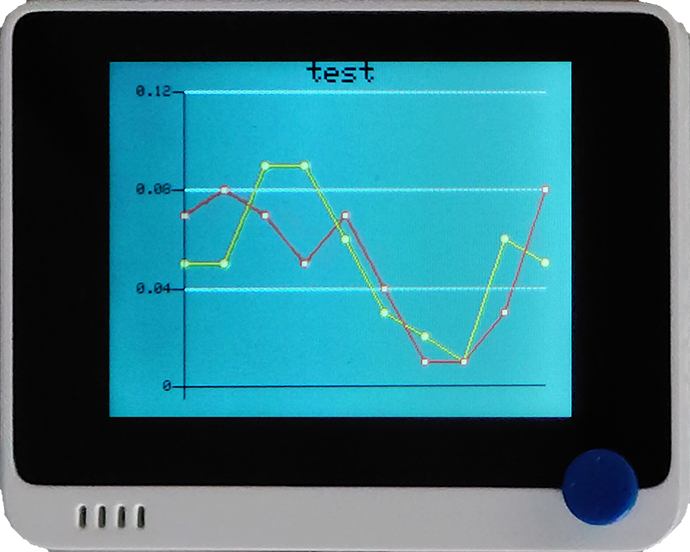
- 折れ線グラフを比較的簡単に表示することができます。
- 写真のように2本の線を描かせることもできます

#define max_size 50        //maximum size of data
doubles data;              //Initilising a doubles type to store data
TFT_eSprite spr = TFT_eSprite(&tft);  // Sprite
void setup() {
    tft.begin();
    tft.setRotation(3);
    spr.createSprite(TFT_HEIGHT,TFT_WIDTH);
}
spr.fillSprite(TFT_WHITE);
if (data.size() == max_size) {
    data.pop(); //this is used to remove the first read variable
}
data.push(0.01 * random(1, 10)); //read variables and store in data
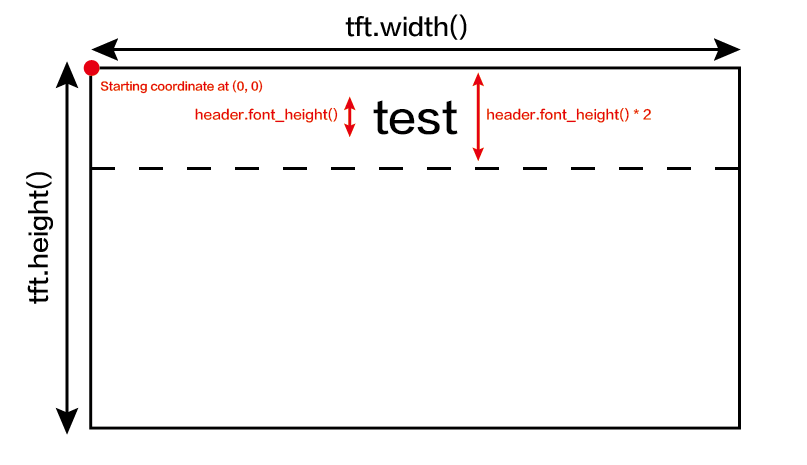
//Settings for the line graph title
auto header =   text(0, 0)           //starting coordinates of title
                .value("test")      //actual title of the line graph
                .align(center)      //horizontal alignment of title
                .valign(vcenter)    //vertical alignment of title
                .width(tft.width()) //width of the title
                .thickness(3);      //thickness of the font

 header.height(header.font_height() * 2); //the height of title is the twice the height of the font
    header.draw();
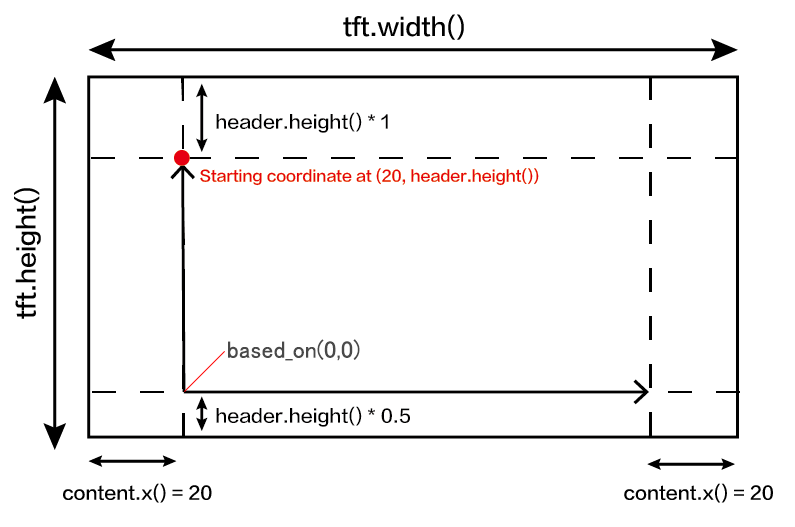
//Settings for the line graph
auto content = line_chart(20, header.height()); //(x,y) where the line graph begins
   content
        .height(tft.height() - header.height() * 1.5) //actual height of the line chart
        .width(tft.width() - content.x() * 2) //actual width of the line chart
        .based_on(0.0) //Starting point of y-axis, must be a float
        .show_circle(false) //drawing a cirle at each point, default is on.
        .value(data) //passing through the data to line graph
        .color(TFT_PURPLE) //Setting the color for the line
        .draw();
spr.pushSprite(0, 0);
delay(50);
#include"seeed_line_chart.h" //include the library
TFT_eSPI tft;

#define max_size 10 //maximum size of data
doubles data; //Initilising a doubles type to store data
doubles data2; //Initilising a doubles type to store data

TFT_eSprite spr = TFT_eSprite(&tft);  // Sprite

void setup() {
    tft.begin();
    tft.setRotation(3);
    spr.createSprite(TFT_HEIGHT,TFT_WIDTH);
}

void loop() {
    spr.fillSprite(TFT_DARKGREY);
    if (data.size() == max_size) {
      data.pop();//this is used to remove the first read variable
    }
    data.push(0.01 * random(1, 10)); //read variables and store in data
    //Settings for the line graph title
    auto header =  text(0, 0)
                .value("test")
                .align(center)
                .valign(vcenter)
                .width(tft.width())
                .thickness(2);

    header.height(header.font_height() * 1);
    header.draw(); //Header height is the twice the height of the font

  //Settings for the line graph
    auto content = line_chart(20, header.height()); //(x,y) where the line graph begins
         content
                .height(tft.height() - header.height() * 1.5) //actual height of the line chart
                .width(tft.width() - content.x() * 2) //actual width of the line chart
                .based_on(0.0) //Starting point of y-axis, must be a float
                .show_circle(true) //drawing a cirle at each point, default is on.
                .value(data) //passing through the data to line graph
                .color(TFT_YELLOW) //Setting the color for the line
                .draw();

    spr.pushSprite(0, 0);

     if (data2.size() == max_size) {
      data2.pop();//this is used to remove the first read variable
    }
    data2.push(0.01 * random(1, 10)); //read variables and store in data
    auto content2 = line_chart(20, header.height()); //(x,y) where the line graph begins
         content2
                .height(tft.height() - header.height() * 1.5) //actual height of the line chart
                .width(tft.width() - content.x() * 2) //actual width of the line chart
                .based_on(0.0) //Starting point of y-axis, must be a float
                .show_circle(true) //drawing a cirle at each point, default is on.
                .value(data2) //passing through the data to line graph
                .color(TFT_RED) //Setting the color for the line
                .draw();

    spr.pushSprite(0, 0);
    delay(1000);
}