棒グラフ

できること

  1. 棒グラフを比較的簡単に表示することができます。
  2. 折れ線グラフを重ねて表示することもできます。

ライブラリのインストール

  1. 次のサイトから Seeed_Arduino_Histogram-master.zip をダウンロードします。
    https://github.com/Seeed-Studio/Seeed_Arduino_Histogram
  2. 画面が表示されたら、右の方のをクリックします。
    Download ZIP をクリックします。
    適当な場所に Seeed_Arduino_Histogram-master.zip を保存してください。(解凍しません)
  3. ダウンロードした Seeed_Arduino_Histogram-master.zip を、Arduino IDEにインストールします。
    Arduino IDEを起動して、スケッチ > ライブラリをインクルード > .ZIP形式のライブラリをインストール...を選択します。
  4. 先ほど保存した Seeed_Arduino_Histogram-master.zipを選択して「開く」ボタンをクリックします。
  5. インストールが始まります。
  6. ライブラリが追加されました。「ライブラリをインクルード」メニューを確認してください。と表示されれば成功です。
    スケッチ > ライブラリをインクルード で表示されるウィンドウをスクロールして真ん中あたりに「Seeed Arduino Histogram」と表示されています。

棒グラフを初期化する

  1. 次のように棒グラフライブラリなどを初期化します。
#include <TFT_eSPI.h> // Hardware-specific library
#include <SPI.h>
#include"Histogram.h"
 
TFT_Histogram histogram=TFT_Histogram(); //Initializing Histogram
TFT_eSPI tft = TFT_eSPI(); //Initializing TFT
 
void setup(void) {
  tft.init();
  histogram.initHistogram(&tft);
  ...
}

棒グラフの列を作成する

  • labelは棒グラフの列名
  • NOは棒グラフの番号タグ
  • Histogram_valueはデータの値
  • Histogram_WIDTHは棒グラフの幅
  • colorは棒グラフの色
void formHistogram(String label,int NO,double Histogram_value,int Histogram_WIDTH,uint32_t color);

ヒストグラムを表示する

void showHistogram();

存在する列の値を変更する

既に存在する棒グラフの番号を指定することにより値などを変更できます。
  • NOは棒グラフの番号タグ
  • labelは棒グラフの列名
  • Histogram_valueはデータの値
  • colorは棒グラフの色
void changeParam(uint8_t NO, String lable, float Histogram_value, uint32_t color);

ヒストグラムから列を削除する

  • NOは棒グラフの番号タグ
void deleteCylinder(uint8_t NO);

ヒストグラムへの折れ線グラフの追加

  • colorは棒グラフの番号タグ
void lineChart(uint32_t color);

ヒストグラムの軸を隠す

  • colorは棒グラフの番号タグ
void notShowAxis();

その他の便利な機能

  • その他の便利な機能については Histogram.h を参照してください。
  • 全機能を使用しているサンプルコードも参考にしてください。
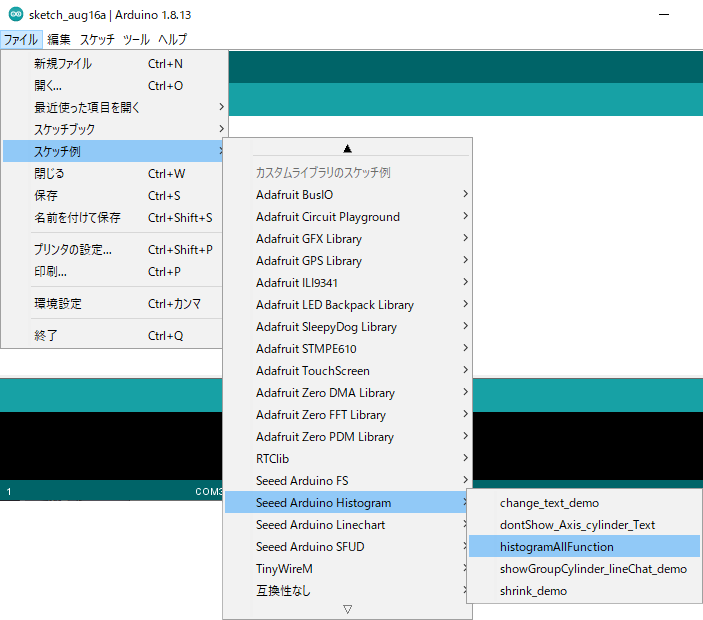
    ファイル > スケッチ例 > Seeed Arduino Histogram > histogramAllFunction

/*
  All functions of histogram
*/

#include <TFT_eSPI.h> // Hardware-specific library
#include <SPI.h>
#include"Histogram.h"

TFT_Histogram histogram=TFT_Histogram();
TFT_eSPI tft = TFT_eSPI(); 
    
void setup(void) {
  tft.init();                  
  histogram.initHistogram(&tft);                                             //Initialize histogram 
  histogram.formHistogram("a",1,50.55,40,TFT_RED);                          //Input lable,NO,value(high),width,colour
  histogram.formHistogram("b",2,20,40,TFT_BLACK);
  histogram.formHistogram("c",3,100,50,TFT_GREEN);
  histogram.formHistogram("d",4,53,50,TFT_BLUE);
  histogram.formHistogram("e",5,133,30,TFT_YELLOW);                        //Initialize histogram 
  histogram.formHistogram("f",6,53,50,TFT_ORANGE);
  histogram.formHistogram("g",7,80,50,TFT_PINK);

  histogram.showHistogram();                                                                   //The function is show  the histogram  on screen
  delay(3000);
  histogram.changeParam(6,"F",56,TFT_PINK);                                                //The function is change these parameter of the histogram
  histogram.deleteCylinder(7);                                                              //The function is delete a cylinder 
}

void loop() {
  histogram.showHistogram();
  delay(2000);
  histogram.setTextSizeColourHistogram(1,2,TFT_BLACK,TFT_GREEN,TFT_WHITE);            //The function is set size of text of the histogram  and the background of screen
  delay(2000);
  showSeeed(TFT_BLUE);                                                              //Show some chars
  delay(2000);
  histogram.shrinkShowHistogram(50,60,3);                                         //The function is show histogram more little
  delay(2000);
  histogram.shrinkShowHistogram(130,180,2);                                     //The function is show histogram more little
  delay(2000);
  showSeeed(TFT_GREEN);
  delay(2000);
  histogram.notShowCylinder(3);                                             //The function is not show a cylindricity of the histogram  on screen
  delay(10);
  histogram.showHistogram();
  delay(2000);
  histogram.notShowAxis();                                              //The function is not show axes on screen
  delay(2000);
  showSeeed(TFT_MAGENTA);
  delay(2000);
  histogram.notShowtext(1);                                         //The function is not show text of a cylinder on screen
  delay(2000);
  histogram.groupCylinder(2);                                     //The function is to group these cylinders.
  delay(2000);
  histogram.lineChart(TFT_BLACK);                                // The function is to show a line chart. 
  delay(2000);

  showSeeed(TFT_ORANGE);
  delay(2000);
}

void showSeeed(int colour)
{
  tft.setRotation(3);                                       
  tft.setTextSize(3);
  tft.fillScreen(colour);  
  tft.drawString("Welcome",50, 50);
  tft.setTextSize(5);
  tft.drawString("To Seeed!",50, 120);
  tft.setRotation(2);                                       
}